Discharge
What was the discharge of the Dora Baltea (main river) since the beginning of the year?
Hydrological data of the Aosta Valley
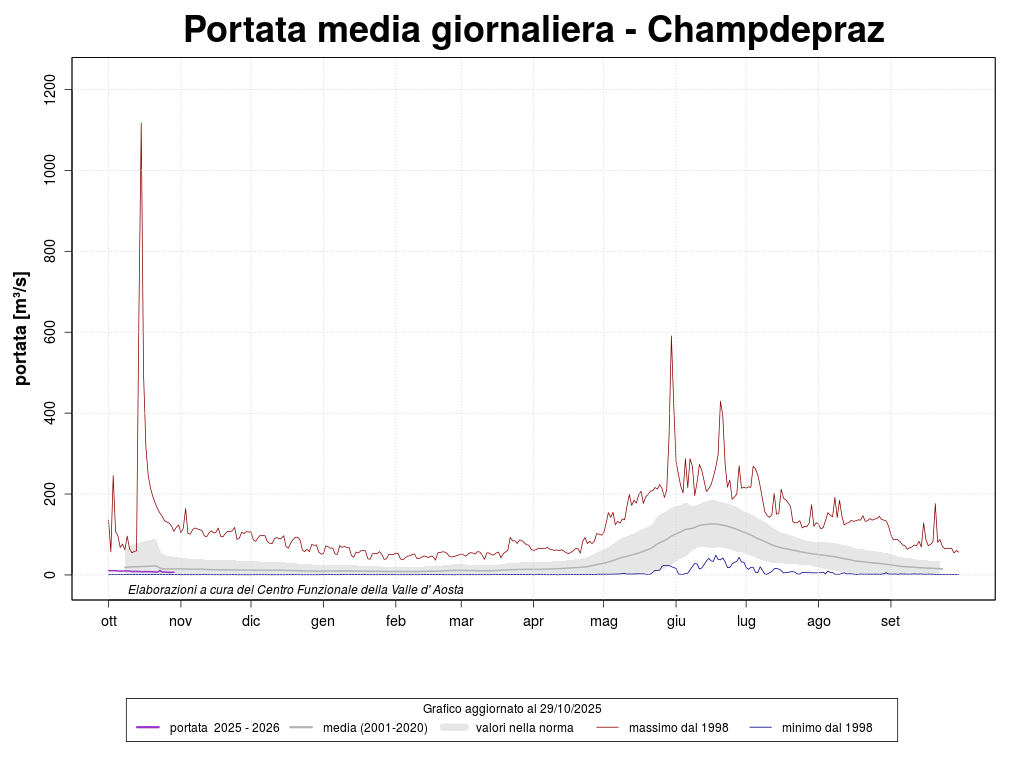
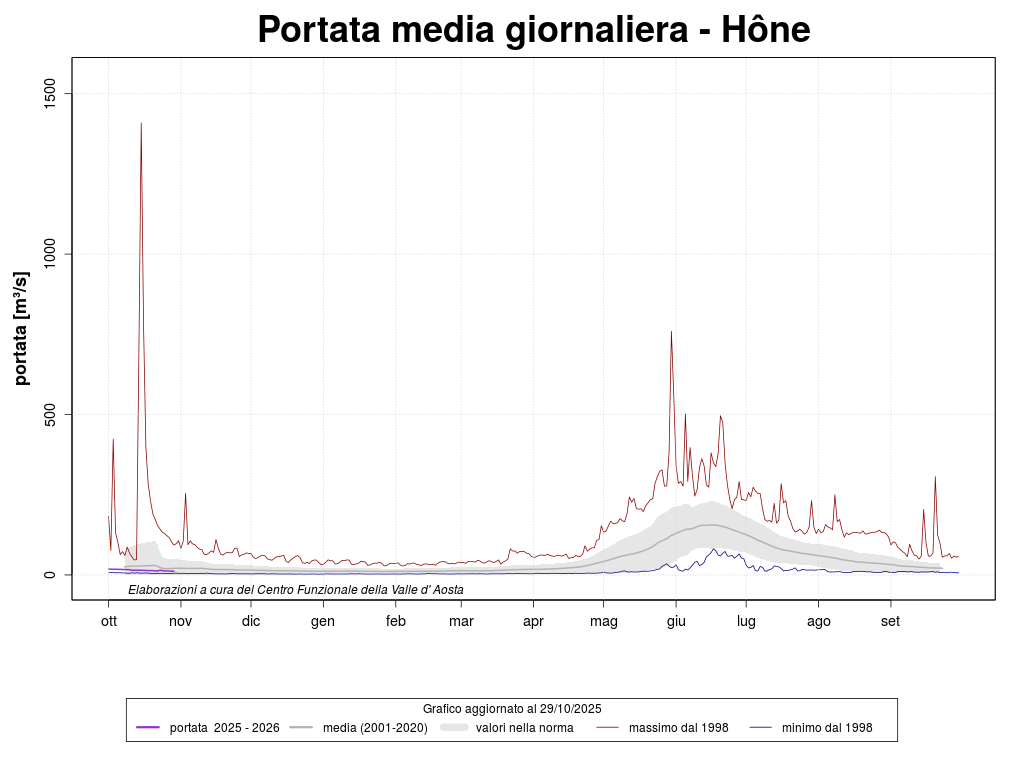
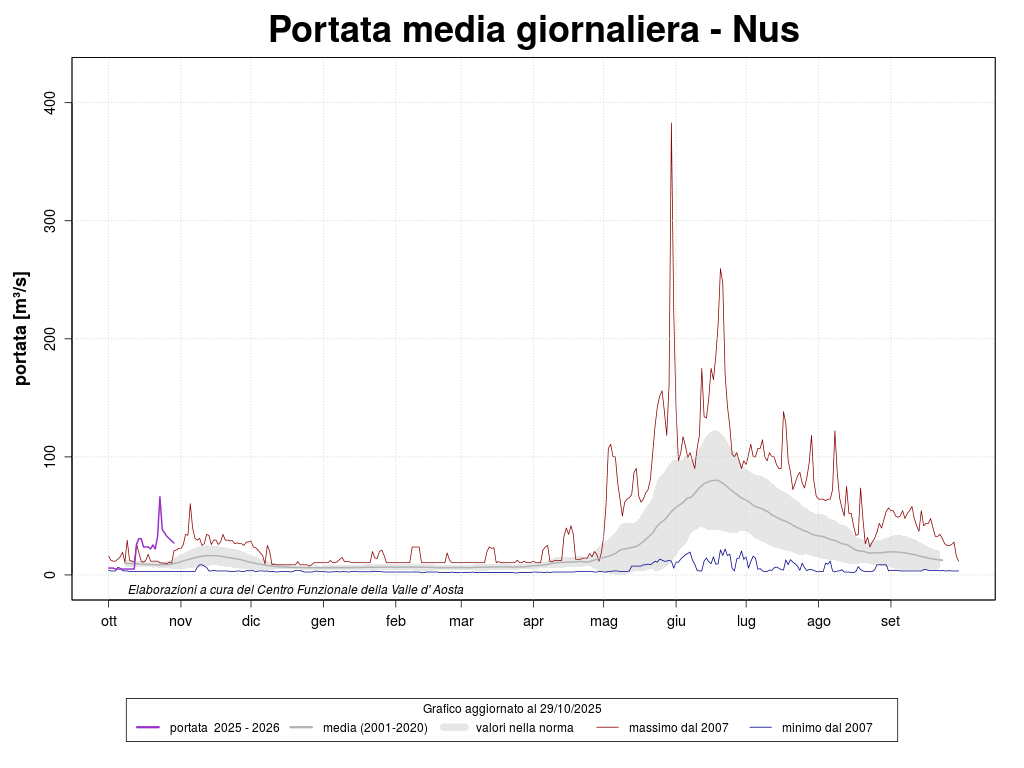
The graph shows the discharge in the following sections: Nus, Hône, Champdepraz and Tavagnasco since the beginning of the year.
Champdepraz
Hône
Nus
Tavagnasco
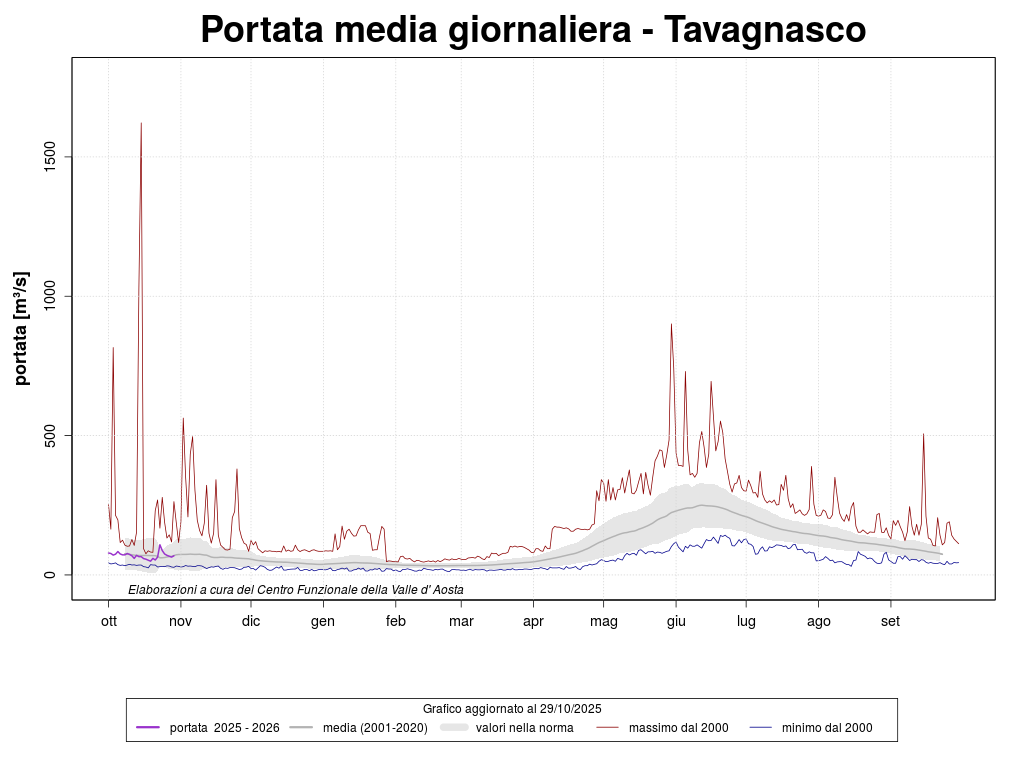
Comparison with the history
Historical series of discahrge in our stations
This graph shows the discharge in four stations: Nus, Hône, Champdepraz and Tavagnasco since 2000.
The data of the last year is highlighted in a different colour.
